


Benchmarking Allied Health Professions Across Australia’s Primary Health Networks: Podiatrists
Allied health workforce planning in Australia is notoriously difficult. As we describe in this article, there is a lack of a clear understanding of what constitutes allied health nationally, no single regulatory model for allied health professions, and numerous different employment and funding models.
Unlike the medical and nursing professions, there are no established workforce ratios for allied health professionals. Allied health benchmarking is compounded by the large overlap of many allied health professional roles and the opportunities for interprofessional substitution.
Despite the challenges of allied health workforce planning, it is widely accepted that there are national allied health workforce shortages across most health professions.
Without accurate data, how then is it possible to establish allied health workforce needs?
Our team at AHPWorkforce has developed a range of tools to support allied health workforce planning, such as this recent workforce supply and needs modelling completed for Speech Pathology Australia.
Given the importance of ensuring that allied health play a key role in optimising health care through diagnosis, prevention, restoration and rehabilitation, we have developed a suite of tools to provide comparative benchmarks of the number of allied health professionals per 100,000 population, mapped to PHNs. We provide an example of this below, using the podiatry profession as an illustration.
Why allied health benchmarks?
Allied health workforce benchmarks across primary health networks in Australia can provide several key benefits.
Optimising service delivery
Benchmarking can help to optimise service delivery by identifying gaps in service provision and ensuring equitable access to care. Discrepancies in allied health worker ratios can lead to certain areas being underserved, compromising patient care. By benchmarking, we can identify these gaps and work towards a more balanced distribution of healthcare professionals.
Resource allocation and planning
Benchmarking facilitates more informed resource allocation and workforce planning. By understanding the current landscape, healthcare leaders can make data-driven decisions about where to focus recruitment efforts, how to allocate funding, and which training opportunities to prioritise.
Promoting quality of care
The quality of care is often dependent on the ratio of healthcare professionals to patients. Too few professionals can lead to burnout and reduced patient care quality, while an excess can result in unnecessary costs. Benchmarking these ratios allows for adjustments that enhance both the quality and efficiency of care.
Informing Policy Decisions
Benchmarking data can also provide robust evidence to inform policy decisions. Policymakers can use this information to advocate for increased funding, training programs, and other initiatives that support the allied health workforce.
Supporting Rural and Remote Areas
In Australia, the healthcare challenges faced by urban areas can significantly differ from those in rural and remote areas. Benchmarking workforce ratios can highlight discrepancies in access to allied health services between these areas, prompting targeted strategies to support rural and remote health.
Benchmarking allied health workforce ratios is not just a statistical exercise; it’s an essential strategy to ensure the efficiency, equity, and effectiveness of Australia’s primary health networks. By promoting a more balanced, informed, and evidence-based approach, we can ensure that all Australians, regardless of where they live, have access to high-quality allied health services.
Podiatrists kick above their weight for older Australians
Podiatrists plays a crucial role in Australia’s healthcare system by supporting many Australians in their efforts to maintain their independence since both foot pain and impaired balance restrict mobility.
Are there sufficient podiatrists to meet population needs and where can they be found?
Benchmarking podiatrists by PHN
Over 1.8 million people suffer from diabetes in Australia. Of these, 30% have at least one risk factor for foot disease, and more than 20,000 suffer from Diabetes related Foot Disease (DFD).3
DFD accounts for approximately 2% of all hospital admissions1, and is estimated to cost more than $1.6 billion annually2. Diabetes related foot disease was responsible for 5,400 lower limb amputations in 2016. Moreover, amputation rates in Australia, especially among First Nations Australians, are alarmingly high, compared to global rates and have been found to be up to 40 times greater than rates for non-Indigenous Australians.4 This rate varies by location and the timing of the study. The provision of optimal care for the management of DFD in Australia has been estimated to generate potential savings of $2.7 billion over 5 years 6.
Despite the excess risks for First Nations peoples, the Northern Territory, where 32% of the population identify as First Nations, has only 13 podiatrists per 100,000 population.
One in six Australians is 65 years or older, and for many allied health professionals (AHPs) this demographic represents one of the largest groups in need of their skills and knowledge. The significant role of AHPs in helping people maintain their independence, particularly where advanced age is combined with chronic health conditions, has been recognised by Primary Health Networks (PHNs).
Benchmarking podiatrists distribution across Primary Health Networks
There are 31 PHNs in Australia, independent organisations funded by the Australian Government to coordinate primary health care in their region, intended to streamline health services and better coordinate care.
Based on the March 2023 Podiatrists Registrant report, there were 5,804 practising podiatrists registered in Australia.
The majority of these podiatrists practice in New South Wales and Victoria, with 1,658 and 1,772 professionals respectively. That amounts to 20.1 podiatrists per 100,000 residents in NSW, and 26.4 per 100,000 in Victoria. However, questions arise regarding whether this number is sufficient to address the growing need for podiatry services in these two states, let alone Australia wide.
The interactive map below tells a more complex story, presenting the ratio of podiatrists per 100,000 people for all 31 PHNs.5 Explore the following interactive map and discover the provision of podiatrists in a PHN near you.
Podiatrists per 100,000 by Primary Health Network based on the National Health Workforce Data Tool Retrieved May 17, 2023
Some states, regional and even remote PHNs have the same ratio of podiatrists as their metropolitan counterparts. Take Queensland: Western Queensland has a higher ratio (22 per 100,000) than Brisbane South, which isn’t far behind Brisbane North which has the highest ratio in the state.
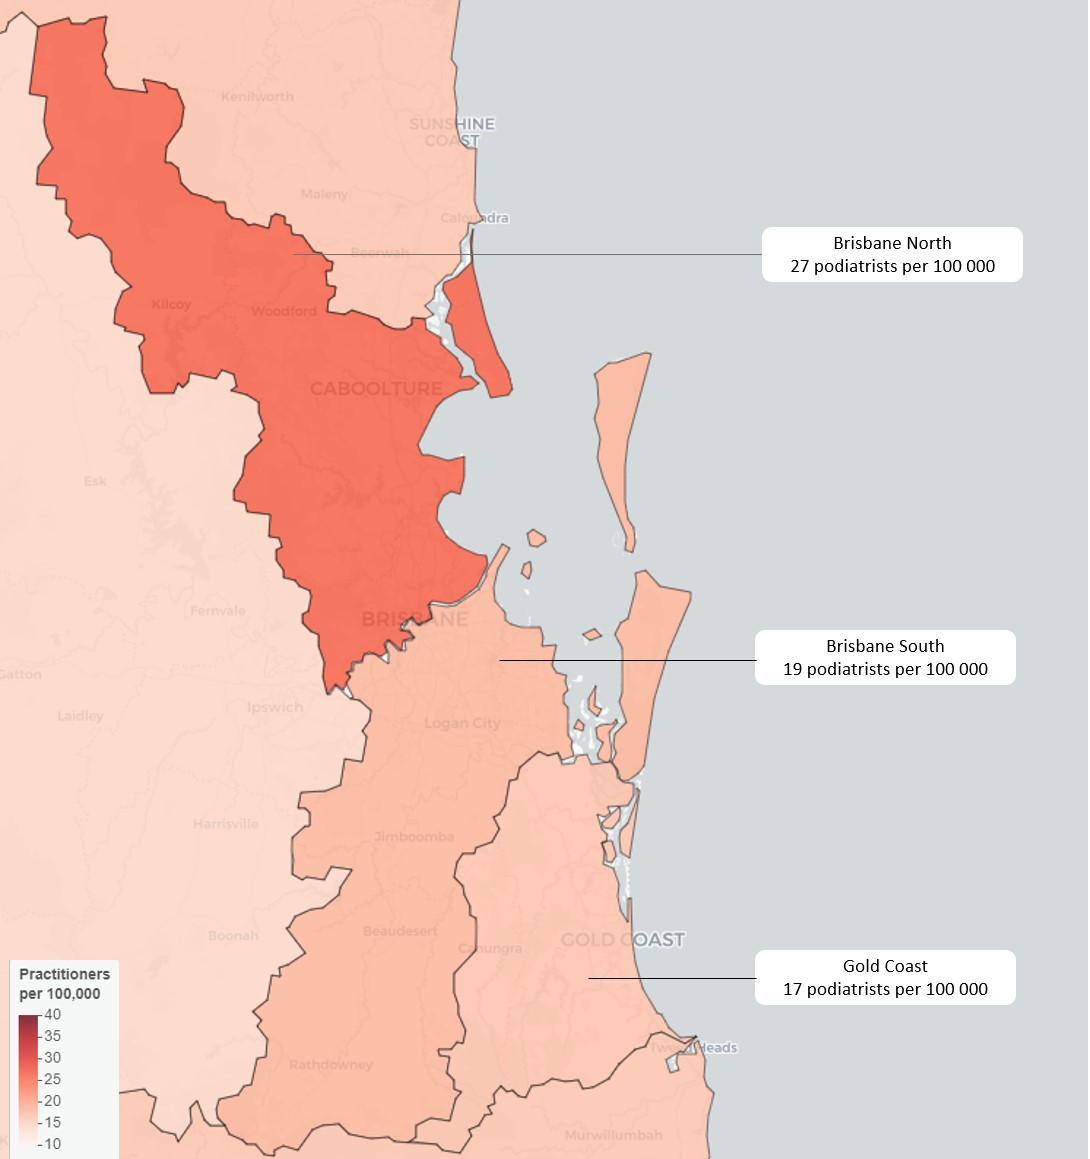
Podiatrists per 100,000 by Primary Health Network covering Brisbane and the Gold Coast5
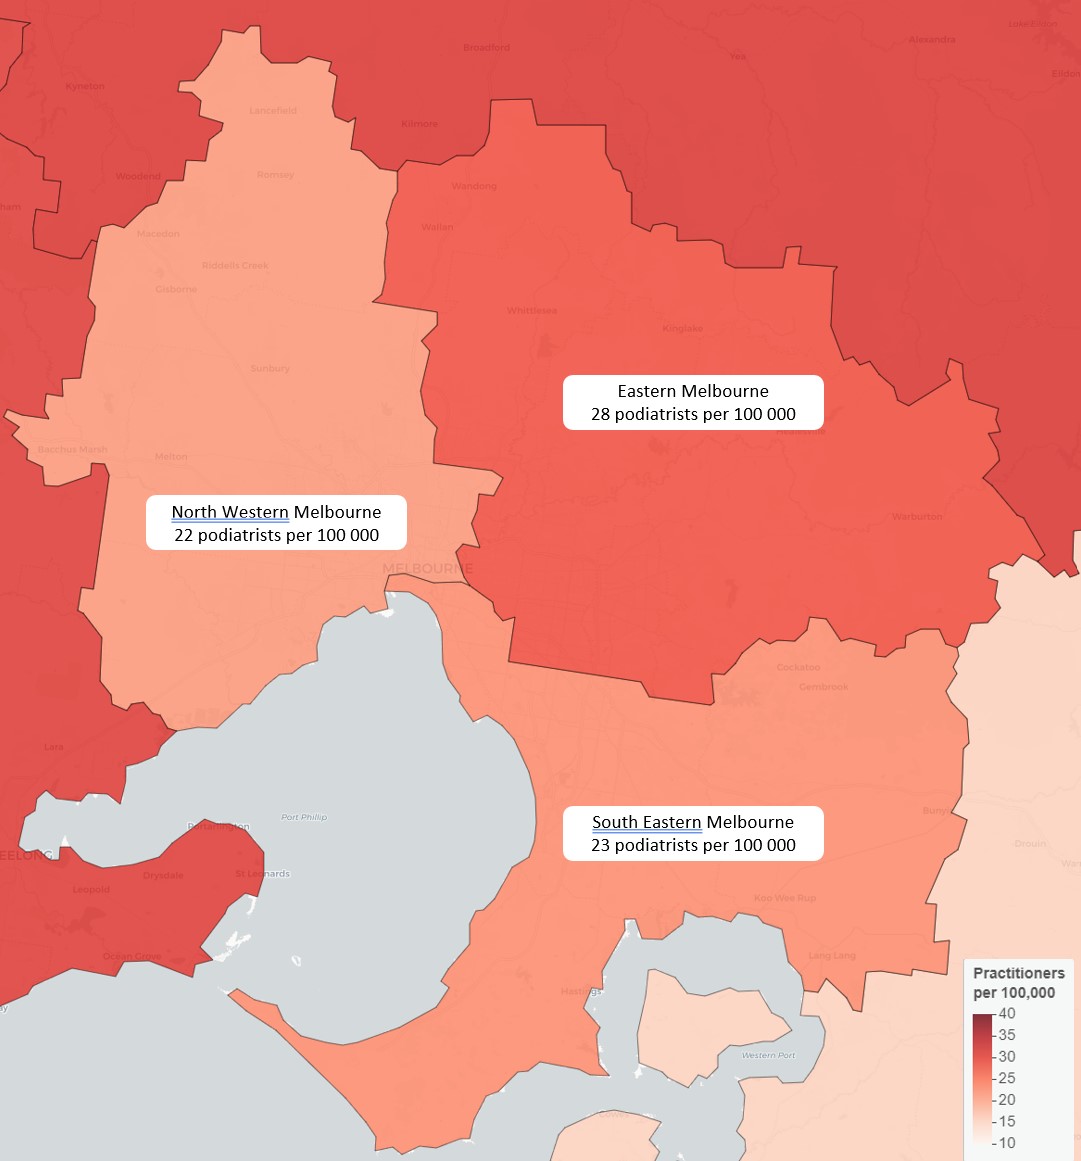
Two PHNs in regional Victoria, Murray and Western Victoria have a ratio of 31 per 100,000 which is higher ratio than any PHN in Melbourne. In fact this is the highest ratio of podiatrists in the nation and equals the provision in Adelaide PHN.
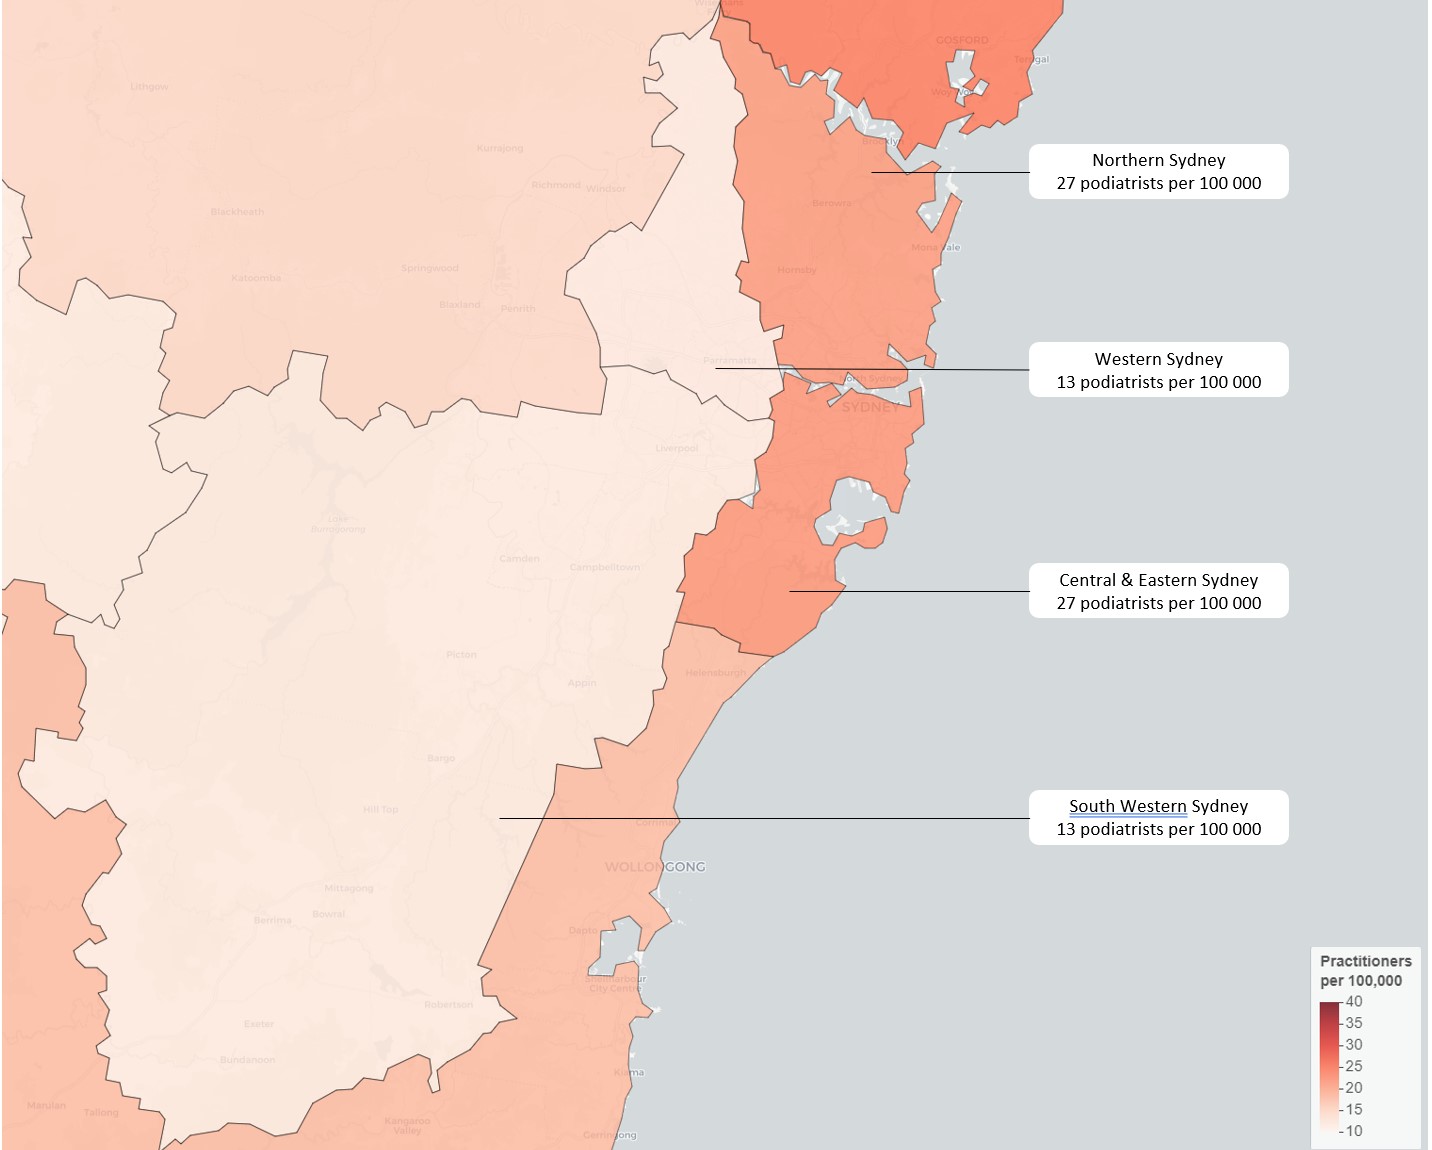
Notably, no PHN in NSW provides equivalent access to podiatry, with Hunter New England and Central Coast coming closest at 24 per 100,000. Those needing urgent appointments in Western Sydney and South Western Sydney may have to travel outside their PHN, as these networks are served by just 13 podiatrists per 100,000.
The usual assumption that rural, regional and remote Australia lacks access to adequate health care holds true in some states. Roughly 30% of South Australia’s population resides in rural or remote parts of the state, and their relative lack of access to podiatrists is magnified by the distances involved. This PHN covers a vast area of approximately 980,000 km2, and many live too far to commute to local towns or to Adelaide for regular appointments. The interactive map indicates that even those remote areas with relatively good service still have access issues based on geography and distance to clinics.
Conclusion
This article illustrates allied health benchmarks using the example of the podiatry profession across PHNs in Australia. However there are large variations in the ratio of podiatrists per 100,000 population, and relatively fewer podiatrists in areas which presumably, would have greater need for podiatrists, such as those with high proportions of First Nations people.
Maldistribution has important social, economic and personal health consequences. Communities in PHNs with poor provision of AHPs face inequitable access to timely and appropriate care. A factor that is likely to exacerbate existing health disparities, with people already at increased risk of poor health (people with existing chronic condition and socioeconomically disadvantaged groups), having less opportunity of receive best practice care at critical times.
As the experience with podiatry demonstrates, when early interventions are missed, and conditions worsen, there is an increased demand for GP appointments and hospitalisations. This increases the burden on the health budget, and has economic consequences for the patients as well. Consider the effect of compromised health on personal income and the cost of travel to a distant clinic.
The effect on the workplace satisfaction is a further concern. AHPs working in under resourced environments may face heavier workloads, longer wait times, and increased job stress. Over time, this strain may contribute to burnout among healthcare professionals.
Addressing the maldistribution of AHP requires detailed knowledge of the workforce and the need for service in different communities. This will allow targeted efforts to incentivise practitioners to work in underserved regions, such as offering financial incentives, improving professional support networks, and implementing rural placement programs during education and training. By ensuring a more equitable distribution of AHPs, Australia can enhance access to essential health services, reduce health disparities, and improve overall health outcomes.
AHP Workforce provides allied health workforce planning, strategy and consulting for employers, managers and stakeholders. For data-driven allied health workforce solutions, contact us today.

